Berkshire Is Buying Lennar. My Model Shows Why the Price Matters.
Berkshire Hathaway recently had nearly $400 billion in cash. Now it is putting some of it into Lennar. My valuation model reveals a striking gap between market price and intrinsic value.
Berkshire Hathaway ($BRK.B) recently had nearly $400 billion in cash. For years, Warren Buffett and his team have repeated the same stance: they “cannot find anything compelling to buy” to “move the needle” for a company of Berkshire’s size.
Then they started building a position in homebuilder Lennar Corp ($LEN).
Berkshire’s latest $348.4 million addition in September 2026 is small by its standards, and even the $2.1 billion total position barely moves the needle for a company of Berkshire’s size.
But the interesting part is not the size of the investment.
It is the price they paid.
When I run Lennar through my proprietary valuation model, the result is striking: the market price sits far below the model’s estimate of intrinsic value.
And that gap changes the return profile considerably.
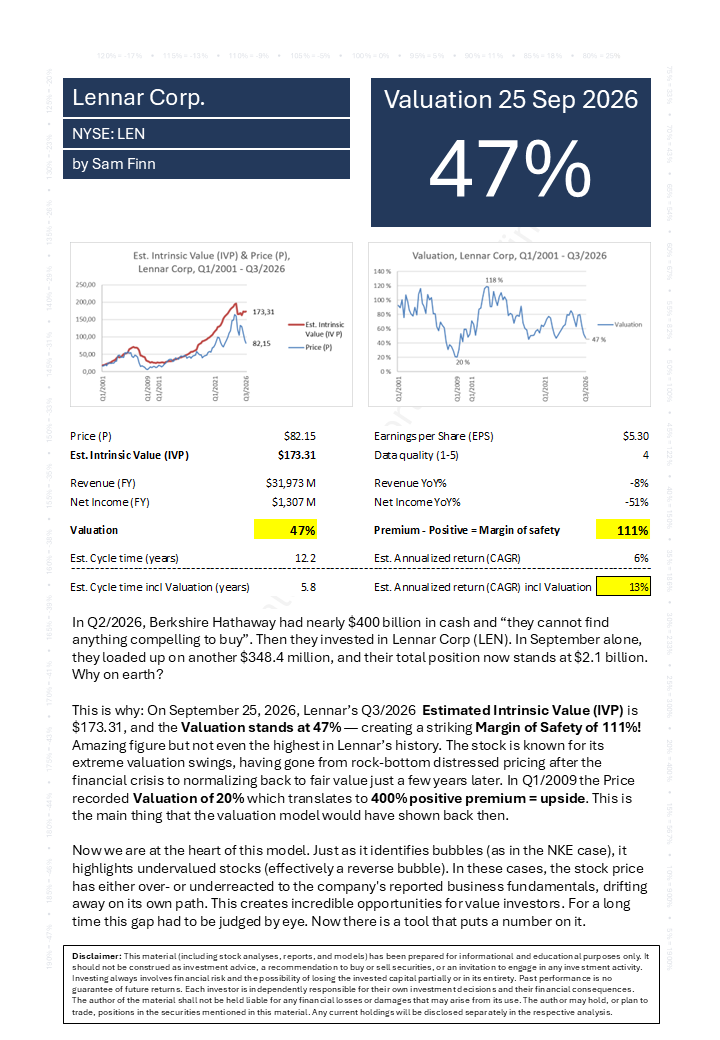
Model Output: 47% Valuation — Estimated Intrinsic Value 111% Above Market Price
Using Lennar’s latest figures as of September 25, 2026, the model produces the following output:
- Current Stock Price (P): $82.15
- Estimated Intrinsic Value (IVP): $173.31
- Valuation (Price / Intrinsic Value): 47%
- Difference to Estimated Intrinsic Value: 111%
In other words, Lennar is currently trading at less than half of the intrinsic value estimated by the model.
The interesting part is not simply that the model considers Lennar undervalued. It is what happens to the expected return profile when the valuation gap is taken into account.
Under normal conditions, the model estimates Lennar’s cycle time — the time required for its value to double — at approximately 12.2 years, corresponding to an estimated annualized return of roughly 6%.
But at the current valuation, that picture changes substantially.
When the 47% valuation is incorporated, the estimated cycle time falls to approximately 5.8 years, increasing the model’s estimated annualized return to around 13%.
The model is not predicting when the market will correct.
It is showing how dramatically the price investors pay can alter the long-term return equation.
When Market Price and Fundamentals Diverge
There are legitimate reasons why the market is cautious about Lennar.
Revenue declined by 8%, while net income fell 51% year over year. High mortgage rates continue to pressure housing affordability and demand, while homebuilders have relied on incentives to support sales.
The market therefore has plenty of reasons to dislike the stock in the short term.
But cyclical industries can also produce substantial disconnects between business fundamentals, investor expectations and market prices.
This is where the valuation model becomes particularly interesting.
A market price can move substantially above or below the level suggested by the underlying financial data. The model is designed to quantify that divergence rather than relying on a visual or subjective assessment of whether a stock simply “looks cheap” or “looks expensive.”
Lennar has experienced extreme valuation swings before.
In Q1 2009, its valuation fell to approximately 20% of the model’s estimated intrinsic value. Over time, that extreme disconnect eventually normalized.
Today’s 47% valuation is nowhere near that historical extreme.
But it is unusual enough to deserve attention — particularly when one of the world’s most famous value-oriented investors has simultaneously been accumulating the stock.
That does not prove Berkshire is using the same reasoning as my model.
But the alignment is certainly worth examining.
What the Model Shows — and What Stays Under the Hood
I have spent more than a decade developing this valuation framework.
The model combines financial statement data with market valuation to estimate intrinsic value, valuation levels, cycle times and expected returns.
But the framework itself is proprietary.
I will show what the model produces.
I will not disclose the underlying mechanics that produce those results.
That distinction is important.
The purpose of Sam Finn Reports is not to publish the formula behind the model. It is to use the model to identify situations where market prices appear to have disconnected materially from underlying business fundamentals — in either direction.
That means identifying both overvaluation and undervaluation, and quantifying how far market price has moved from the model’s estimated equilibrium.
Lennar is an interesting example of the latter.
Examine the Lennar Case Yourself
Rather than asking readers to simply accept the conclusion, I have made the full Lennar valuation report available for free.
It includes the model outputs, valuation metrics and underlying figures used in this analysis, while keeping the proprietary mechanics of the framework under the hood.
You can examine the numbers and decide for yourself whether the valuation gap is justified.